Monday 12 December 2016

This goes against my dividend ideology but consider…...


So as most people I talk to regarding stocks, investing, money management probably know that I am a strong advocate of dividend investing.  Buying quality stocks that pay a good dividend, raises its dividend regularly, has a good dividend payout ratio, has a good P/E ratio, and is a good DRIP candidate.

But after 31 stocks that I have purchased over time and have been dripping for a while now, things need to be more entertaining.

In my talks with many individuals, I engaged in conversation with 1 person regarding options trading.  Amazing returns in short periods of time, sometimes in minutes such as when you buy calls or puts right before an earnings report.  So basically,  buying either puts or calls is your gamble on whether the stock goes up or down.  With dividend investing, you are basically only betting on the stock going up, going up means you are making money.  When a stock goes down, you lose money.

With call options, you make money when the stock goes up.

With put options, you make money when the stock goes down.

Now options trading requires an entirely new type of trading account, an account on margin, basically you are trading on credit.  Now to me that is too much work, I am happy with my regular trading account where I can buy stocks and ETFs.  But how can my regular trading account benefit from something going down.

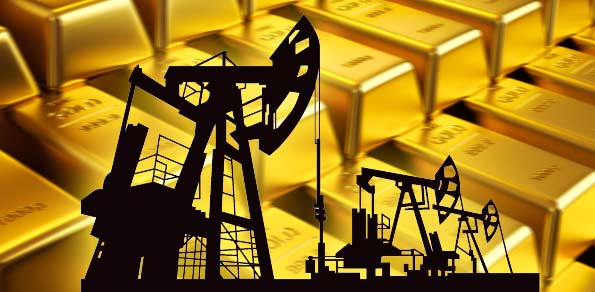
Consider Horizon ETFs, in particular commodity leveraged ETFs and commodity leveraged inverse ETFs.  Here is there link Horizon ETFs

The 4 or in this case 8 ETFs that I have added to my watch list are HOU.TO, HOD.TO, HGU.TO, HGD.TO, HZU.TO, HZD.TO, HNU.TO and HND.TO

So to understand what each ETF does, look at the letters in the ticker.  The "H" simply means its an Horizions ETF, the next letter is either U or D, up or down.  The 3rd letter tells you what this ETF is tracking, O is Crude (Oil), G is gold, Z is Silver, and N is Natural Gas.  All of these commodities are tracked daily on sites like CNBC and BNN .

So after you add to these to your watch list and start to see how they react to commodity prices.  If the price of crude goes up 4% then the HOU etc goes up about 8%.  Yes that right, you can make 8% in 1 trade.  Remember the ETF is leveraged so anything the commodity does, its 2 times.  Now if the price of Crude drops 4%, the HOD ETF will gain 8%.  How is that possible, remember its inverse leveraged, the "DOWN" ETF likes when something goes down.

These ETFs can be used as a day trade only, do not hold these any longer.  The leveraged aspect of them is very powerful.

So add these tickers to your watch list if you want to gamble a bit without opening an options account.

Disclaimer : I have traded all of the ETFs above.

Friday 9 September 2016

Hate paying bills? Get back at them by investing in them.


We all have to do it.  Pay bills.  We all hate it.  There is no way to get away from it.  "They" get richer and we get poorer.  The only way to get back at them is to invest in them.  If you can't beat them, join them.  The old saying goes.  For all the money you pay into your bills, remember there are hundreds, thousands, even millions of people paying the same bill.  What does that mean to the company receiving the money?  Profits.  Revenue.  Goods sold.  If you ever thought that a bill you are paying will ever stop.  Think of it this way, the company on the receiving end thinks the same way but in a greedy way.  They like your money.

The following are 2 bills that everyone hates to pay and why you should invest in them.

Telus Corporation (T.TO)


Telus is considered to one of the big 3 stocks in telecommunications so if you own a cell phone, chances are you pay Telus a bill.  They like overages on your data plan, they like overages on your day time minutes.  All more money for them, more out of your pockets.  Get back at them by investing in them.

Telus is considered a forever stock with a great dividend.  Basically you buy the stock and hold it forever and watch the dividends grow.  Over the years Telus has developed a reputation as one of the better dividend paying stocks on the TSX.  It continues to today.

Telus currently pays out a quarterly dividend of $0.46 per share which given the current stock price of $42.03 gives the company a handsome and attractive dividend yield of 4.37%  The company has been raising the dividend for several years, which is likely to continue for the next few years.  The projected dividend growth rate is 8% per year.  By comparison and to see exactly what is happening.  A decade ago, Telus' dividend was $0.136 per share.  In addition to having one of the most safest and best dividends currently, Telus has also engaged in share buy back programs over the years and this has pushed the stock price higher.

Besides having one of the best dividends on the TSX, Telus is also a growth stock.  It is one of those rate stocks that can provide great dividends and growth over time.  While the growth is not the quickest, it is in most part - stable.  The stock is currently trading at $42.03 and over the past 3 years has appreciated by 31%.

Onto the numbers.  There are many metrics that can and will be used to determine if a stock is a good buy or not.  For Telus, the current payout ratio is 73.95%  Most investors like a payout ratios to be under 80% which basically tells us that Telus can maintain paying their current dividend very easily for the long term.

In the short term, the Beta is currently at 0.55  The Beta basically tells us that if it is under 1, the stock is not volatile compared to the market.  If it is at 1 or over, then the stock price can change violently compared to the market.  Telus' Beta is good.

So using my theory of 1 Drip.  You can purchase 100 shares of Telus for $4,203 and receive $46 in dividends which you will register as a DRIP.  The next time you get a dividend it will be 101 shares paying you $46.46 and so on and so on.  This setup should keep you in DRIPs and additional stocks for a long time.  (just as long as the price of the stock does not go above $46 - but then that is a good thing)

Enbridge Inc (ENB.TO)


Don't like to pay that gas bill from Enbridge.  Get back at them.  Invest in them.  Enbridge's business is the transporting and distributing of energy in Canada and the United States.  They have pipelines and terminals.  They are also involved in renewable energy projects such as wind, solar, and geothermal projects.

Enbridge distributes natural gas to 2.1 million customers.

Now when you think of Enbridge, you think of the price of crude and if the price of crude goes down, Enbridge goes down with it.  Enbridge is a lower risk investment than the many other energy companies.  Less than 5% of its business is subject to direct commodity price exposure.  Further, 95% of its cash flows come from strong, long-term contracts.

Onto the numbers.  Enbridge's payout ratio is currently 40% and using the 80% rule, this tells us the dividend is safe and is positioned to grow.

The Beta for Enbridge is 0.66 which tells us that the stock price will not change violently compared to the market.

Enbridge's current quarterly dividend is $0.53 giving a dividend yield of 3.65% at the current stock price of $58.11 Using the 1 Drip model.  You should purchase 120 shares which will give you a dividend payment of $63.60, with the annual dividend hikes, you should be setup for many years with a purchase like this.

DISCLOSURE - I own shares of Telus

Sunday 21 August 2016

Investment metrics : Raising dividends


Another metric that I use when determining when to put my hard earned money to invest is raising dividends.  I like dividend investing, pick your stock, investigate whether it is fits your criteria to be in your portfolio.  Of course, neither me or anyone else can control whether the stock price goes up or down.  I would be lying if I only purchased stocks that increase in value.  That fact is, we can't control anything when it comes to the price of the stock.  What we can control is when to buy and dividends.  For a long term perspective, raising dividends appeal to me, a company that pays outs dividends has an obligation from the board of directors to maintain profits.  In fact, if a company hikes dividends on a regular basis, this translates into the board of directors having not only to maintain profits but to increase them.

An example of the type of chart to look for would be Fortis (FTS.TO).  Currently at a stock price of $42.95 with a quarterly dividend of $0.375 per share, Fortis' dividend yield is 3.49%  The dividend yield for any stock can be calculated by this simple formula.

Dividend per share paid times number of times paid during year / stock price

In Fortis' case, the calculation would be:

(0.375 x 4) / 42.5 = 3.49%

The formula can be changed easily when dividends are paid monthly as opposed to quarterly simply by change the 4 to a 12 in the above formula.

That being said, my ideal stock would have a dividend yield between 3.00% to 5.50%  This is what I would consider the sweet spot of dividend yields.  It gives you enough skin in the game and is also not being greedy.  There are tons of stocks with dividend yields above 5.50% but a high yield indicates a possible dividend cut.  Who wants that.

Here is a chart that sums up the last 4 years of dividend payments for Fortis:


Dividend Date
Dividend
Aug 17, 2016
0.375
May 16, 2016
0.375
Feb 15, 2016
0.375
Nov 16, 2015
0.375
Aug 17, 2015
0.34
May 14, 2015
0.34
Feb 12, 2015
0.34
Oct 22, 2014
0.32
Aug 13, 2014
0.32
May 14, 2014
0.32
Feb 12, 2014
0.32
Nov 13, 2013
0.31
Aug 14, 2013
0.31
May 15, 2013
0.31
Feb 12, 2013
0.31
Nov 14, 2012
0.3
Aug 15, 2012
0.3
May 15, 2012
0.3
Feb 13, 2012
0.3
As you can, the amount of the dividend paid by the company increases once a year.  I like that.  If I was to go further back, I would see regular increases once a year.  Again I like that.  This is the type of chart I look for in a stock, raising dividends on a regular basis.

So along with my article on P/E ratios as an investment metric P/E Ratio  .  Raising dividends are another metric that I use to determine which stock my hard earned money I invest in.


Monday 1 August 2016

Investment metrics : P/E Ratio


Another conversation happened recently.  "Peter, how do you know which stocks to pick?"  Well I will never advocate that I can pick winners every time.  But to at least know the basics of how to pick and what to look for as a "retail investor".  Since this term has been given to us by the real investors, aka the fund managers.  When a fund has a bad day, nothing really happens, they lose money and the fund manager continues with his life.  If a retail investor has a bad day, it can change your lifestyle if you are not careful.  That being said, to be careful, I use certain investment metrics to help me pick a stock.  This blog post will examine the investment metric called P/E ratio.

The P/E ratio or price-to-earnings ratio is likely one of the best known fundamental ratios, it's also one of the most valuable.  The P/E ratio divides a stock's share price by its earnings per share to come up with a value that represents  how much investors are willing to shell out for each dollar of a company's earnings.


Stock
BMO
BNS
CM
NA
RY
TD
Price
83.70
66.31
99.19
44.71
79.59
56.89
P/E ratio
22.53
11.91
10.88
13.15
11.98
12.96

In the chart above, which is simply the big 6 banks in Canada currently and what their stock price is on August 1, 2016 along with their P/E ratio.  Why I am only using the same stocks in the same industry.  The reason being you can only compare P/E ratios of a similar company, that is where it is most valuable.  You could say it is comparing apples to apples and oranges to oranges.  I would not compare say a bank P/E ratio to a food stock P/E ratio.

So someone asks me which stock to buy that is the best bank.  Most investors have their tickers loaded into yahoo finance or google or even directly on their smart phone.  They right away say either TD bank or National bank.  TD trades at $56.89 and National trades at $44.71 so they are the cheaper stock, right?  That would be incorrect using technical analysis which includes looking at the P/E ratios.  I would answer that CIBC is the cheapest stock right now.  They answer, how can that be?  CIBC is at $99.19 which is almost double TD bank?

The answer lies in the P/E ratio.  CIBC's is at 10.88 vs TD Bank at 12.96  Simply put, investors value TD more than they value CIBC.  "Buy low, sell high".  Remember that old saying.  Using the P/E ratio, you buy lower valued stocks to sell high later.

Looking again at the chart, you will notice that BMO's P/E ratio is higher than the other banks by quite a bit.  Double CIBC's in fact.  This right away tells me that investors have rallied BMO stocks more than other bank stocks.  They think BMO will perform better than the other banks.  If you were to buy bank stocks today, I would take a double take at BMO and maybe avoid buying them using the P/E ratio as your guide.

At some point, you will come to the point of investing money into the bank stocks.  How much money tho?  $1,000? or $5,000?  Let's assume you are going to buy $5,000 worth of bank stock.  For BMO, that would be 58 shares, for TD that would be 87 shares and CIBC that would be 50 shares.  So basically you are buying $5,000 worth of stock but CIBC at $99.19 seems expensive?  It's the same amount of dollars invested, don't assume the stock price determines who is cheap and who is not?

Now you have a general understanding of using P/E ratio analysis to help you determine whether a stock is a buy or no buy.

Sunday 17 July 2016

All banks or 1 bank portfolio


Recently I had somewhat of a reunion with old friends from way back in the day, it must have been close to 2 years since us 3 had a chance to sit down and just chat.  Eventually the topic of money, investments, RRSP, RESPs, etc came up.  Well both have been aware of my financial blog and one of them has been hearing of my speeches of money for I would say 4 plus years now.  My constant ramblings back in the olden days mostly consisted of the evil Mutual Fund MER.  Well to shorten the story, he took an investment course and the instructor even had worse things to say about Fees, Life Insurance, Investments, mutual funds, etc.  It literally opened his eyes, short of acknowledging my ramblings all those years, he has switched.  Well not completely switched.  "No more new money into mutual funds" was his final statement.  He's almost there.  He asked me if I am out of mutual funds, I answered completely.  He's almost switched over, he's shocked about fees.  Self directed accounts is all he has now.  I've explained my rational of dividend investing among other topics like technical investing (50 day Moving average, 200 day moving average, P/E ratios, etc).  Baby steps, baby steps.  If my ramblings open the eyes of someone in my circle and they save money, then I will keep rambling.

Onto my 2nd buddy.  Let's just say he works at a big 5 bank and leave it at that.  His major holding is guess what, a big 5 bank.  Now the question to me was, he has had contributions to his big holding for many years now and it has performed for him.

Before we get into this analysis,  I want to disclose that I own 4 holdings in the banks.  Bank of Montreal, Royal Bank, TD Bank, and Laurentian Bank.  And as consistent with my previous articles, I own enough shares to drip 1 share with the exception of TD, which I drip 2 shares every dividend payment.

Canadian Banks are unique that they operate in an oligopoly, where the sheer scale of them makes it hard for any new entrants into this sector of the economy.  This could be described as a moat in my forever stocks post.  The Canadian banks have many revenue streams, personal / business lending, investment banking (discount brokerages), wealth management, and auto, life, property insurance.  The banks have many years of growth over the years and have provided regular dividend increases.

Now some numbers, I will compare the 10 year, 5 year performances for CIBC, Coke Cola, and Enbridge.  I will compare this to the TSX performance for the same period.

On June 30 for the years 2016, 2011, and 2006 for CIBC, the stock price listed on yahoo finance is $46.74, $60.45, and $97.04  This gives CIBC a 5 year gain of 68%, a 10 year gain of 107%.

On June 30 for the years 2016, 2011, and 2006 for Coke Cola , the stock price listed on yahoo finance is $16.02, $29.02, and $45.33  This gives Coke Cola a 5 year gain of 56%, a 10 year gain of 182%.

On June 30 for the years 2016, 2011, and 2006 for Enbridge, the stock price listed on yahoo finance is $12.33, $26.87 and $54.73  This gives Enbridge a 5 year gain of 104%, a 10 year gain of 343%.

On June 30 for the years 2016, 2011, and 2006 for the TSX, the price as listed on TMX money is 11,612 and 13,300 and 14,04  This gives the TSX a 5 year gain of 5%, a 10 year gain of 21%.

Investors have bought bank stocks thinking they provide the best returns so why not put my life savings  and invest it into 1 bank or only 5 banks.  This means if you have life savings of $600,000 you will buy only CIBC or split it 5 ways into all the banks hoping for the best returns.  Now the 5 year and 10 year numbers I've gotten show that CIBC destroys the TSX which is the benchmark for all investors to beat.  The 10 year for the TSX is 21% while CIBC clocks in at 107%.  It isn't a fair contest.  But if you wanted the best returns, why not put $600,000 into Enbridge, their 10 year is 343% which triples CIBC's stellar decade.  But no one would ever dream about just buying Enbridge.  Same holds true for Coke Cola.

Now to avoid diversification by buying only 1 bank or only the banking industry is just dangerous.  Granted, the canadian Banking industry is well regulated but the 2008-2009 financial crisis showed that banks can fail.  They failed in the U.S. and can fail in Canada.  There is still risk.  There are too many what ifs.  What if the housing bubble bursts, what if the global economy slows, what if interest rates are rise too fast.  What if.

Studies have shown that to get proper diversification you need 18 stocks across 18 different industries to be properly diversified.  Owning just 1 or just 5 stocks seems super risky.

Mutual funds have been saying it since the beginning of time.  Past performances do not guarantee future performances.  So to answer my 2nd buddy's question.  Yes it is risky to only own 1 bank stock or even own just bank stocks.  But if there is an employer matching to your contribution then some of the risk is taken away but there is still risk.

As a shareholder, I hope bank stocks keep generating solid returns and raise their dividend but I would never bet my entire portfolio on 1 stock or 1 industry.  That's why I diversify with telecoms, large consumer discretionary stocks, food stocks, chemical stocks, REITS, cigarettes, etc.  This type of portfolio will hold up better in a downturn then 1 stock or 1 industry.


Monday 11 July 2016

RRSP Bashing


I am sure at any BBQ, any brunch, heck even a good old poker game with the guys can generate conversations regarding money.  One particular topic that I have engaged in a few times this year already are anti-RRSP or RRSP bashers.  Yes, you are correct, there are more than I care to share, numbers of people who do not and will not ever, open an RRSP account.  They say they have to pay all that tax back.  They'd rather just spend that money now and have absolutely not a penny in savings except what they have in their savings or checking account.  I ask them what happens when you get to around 58 or 59 years old, and your salary is at $80,000 a year, what happens when you stop working for medical or some other reason.  Where is that $80,000 or even $50,000 a year going to come from for the next 10 years?  They say, it will work itself out.  Seniors living in poverty is not an idea I enjoy. Neither does the government, that is why they have given us RRSPs.

Anti-RRSP individuals will complain about how you can't use the lucrative dividend tax credit or how contributing to an RRSP would turn a tax free windfall into taxable income when taken out of the RRSP.  Also mentioned is how the 50% reduction in capital gains tax is lost.

This type of ideology stays alive, they can only think of the tax they have to pay rather than take the time to understand how RRSPs work.

So here will be a basic, simple example of how RRSPs work, this could be the last time but I doubt that, as RRSP bashers will always be out there.

Let's look at a simple example.

Assume an individual has saved $10,000 for the year and she's wondering whether she should invest it inside an RRSP or in a non-registered account, or worse, just spend it on something like the mortgage (this could lead to the house poor post I've done before).  We will assume her marginal tax rate is 40% and regardless of which account she chooses to invest in, that that stock triples in 20 years.

Would she be better off in a registered or non-registered account?

Before we get an answer to this question, the tax refund needs to be looked at.  Assume her employer deducts taxes from her pay cheque.  If she contributes $10,000 to her RRSP, she will receive a $4,000 tax refund, so that $10,000 RRSP contribution wouldn't actually cost her $10,000, it would cost her just $6,000 ($10,000 minus the $4,000 refund).

Stated another way, if her marginal tax rate was 40% then $10,000 inside an RRSP (which is pretax dollars) is equal to $6,000 in a non-registered account (which contain after tax dollars)

Now we can use these numbers to do a fair comparison.

First, investing inside the RRSP, the $10,000 would grow 3 times in 20 years to $30,000.  If she sells the stock and withdraws the money, she will pay $12,000 of income tax (40% of $30,000) and be left with $18,000 net.

Now, investing outside the RRSP, the $6,000 would grow 3 times in 20 years to $18,000.  If she sells the stock and withdraws the money, she will pay capital gains tax of 20% (half of 40%) on the $12,000 which is the difference between her purchase price ($6,000) and sell price ($18,000).  After deducting $2,400 in income tax, she is left with $15,600 net.

Winner winner chicken dinner.  RRSPs win.  The return in the RRSP setup is better.  Notice that the difference between the RRSP and the non-registered totals ($18,000 versus $15,600) is equal to the capital gains tax ($2,400).  Far from losing the 50% capital gains reduction, the RRSP avoids capital gains entirely.

With an RRSP, the only tax is on withdrawals.  Bashers love to complain about the tax on withdrawals because it looks so large, but really its just the original tax they deferred plus growth of that tax over time.  As the example above shows, even after pay tax on withdrawals, the RRSP investor still wins.  If an investor's marginal tax rate is lower in retirement, the benefits of the RRSP are ever greater, go ahead, try the withdraws at 30%, and watch how much tax you all be saving on withdrawing $50,000 or $60,000 a year.

You will soon see that the RRSP Bashers are really bashing their own head with the money they are losing in tax savings.